Soil Moisture
Capacitance and Matric Potential
Single and multi-depth sensors and probes
Powerful yet simple graphics
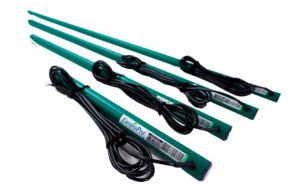
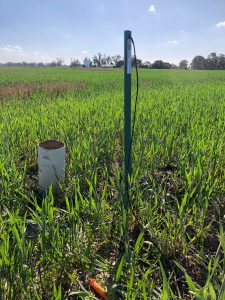
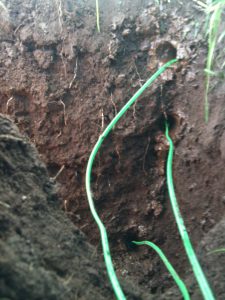
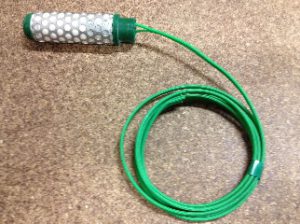
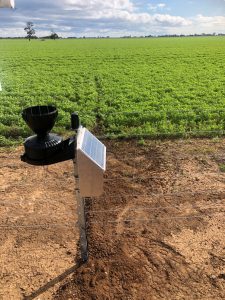
Capacitance Soil Moisture Probes are used in any crop or situation, irrigated or un-irrigated. We use the EnviroPro soil moisture probes, Australian made and sporting a 5 year warranty are our preferred go to capacitance probe to use where suitable.
Matric Potential is best used in crops and pastures that stress easily, often making the job of managing wet soils easier than with capacitance sensors.
How full is your soils bucket?
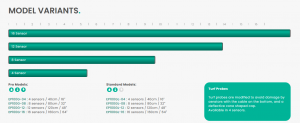
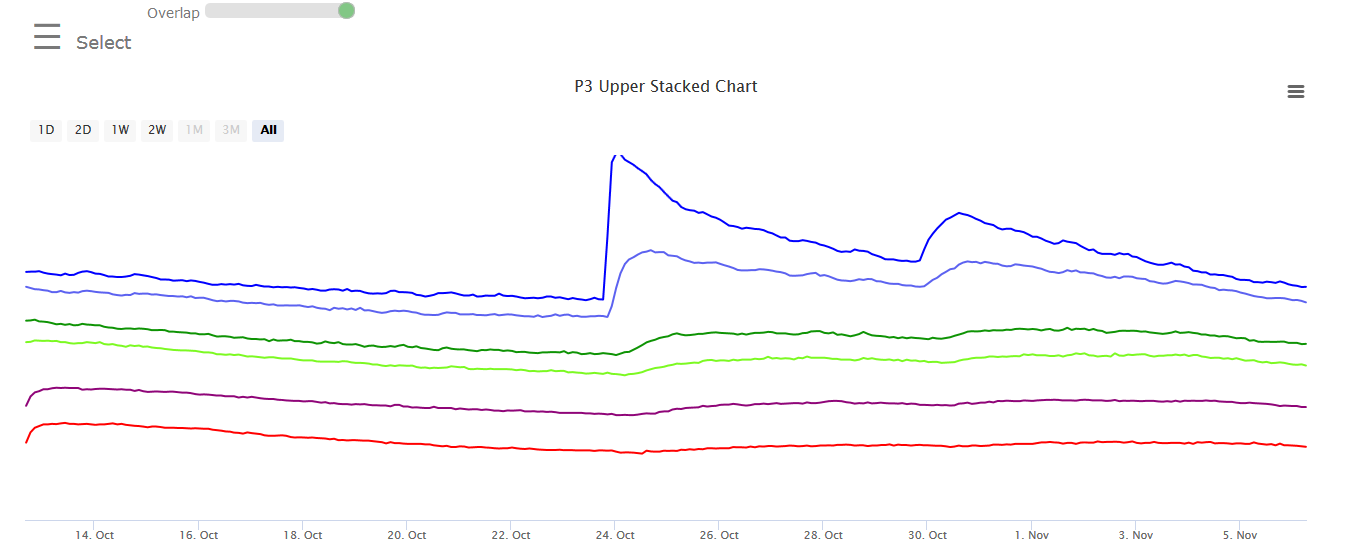
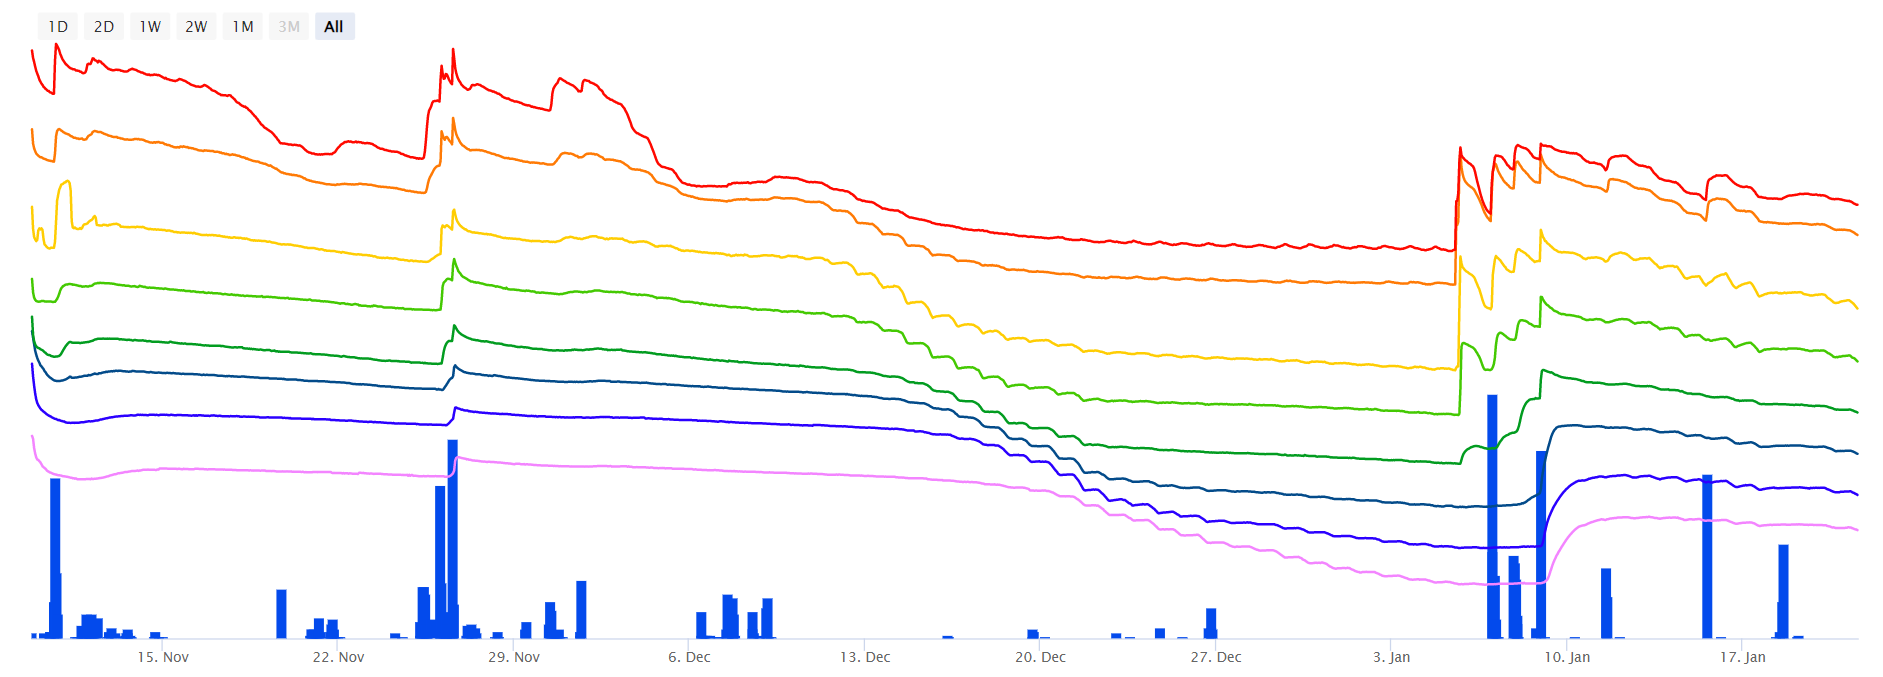
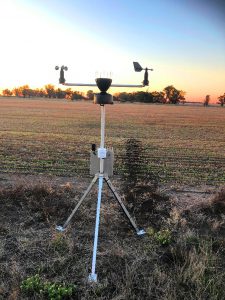
EnviroPro Soil Probes are an Australian made capacitance probe, and available in lengths of 40, 80, 120, 160cm with a sensor every 10cm interval. Users don’t have to view every sensor. When combined with the right graphics this allows a very good view of the whole soil profile and the depths water is being used from by crops. They do a great job of showing the depth water penetrates to with either rainfall or irrigation, and what depth plants are using water from as well as how much water is left “in the bucket".
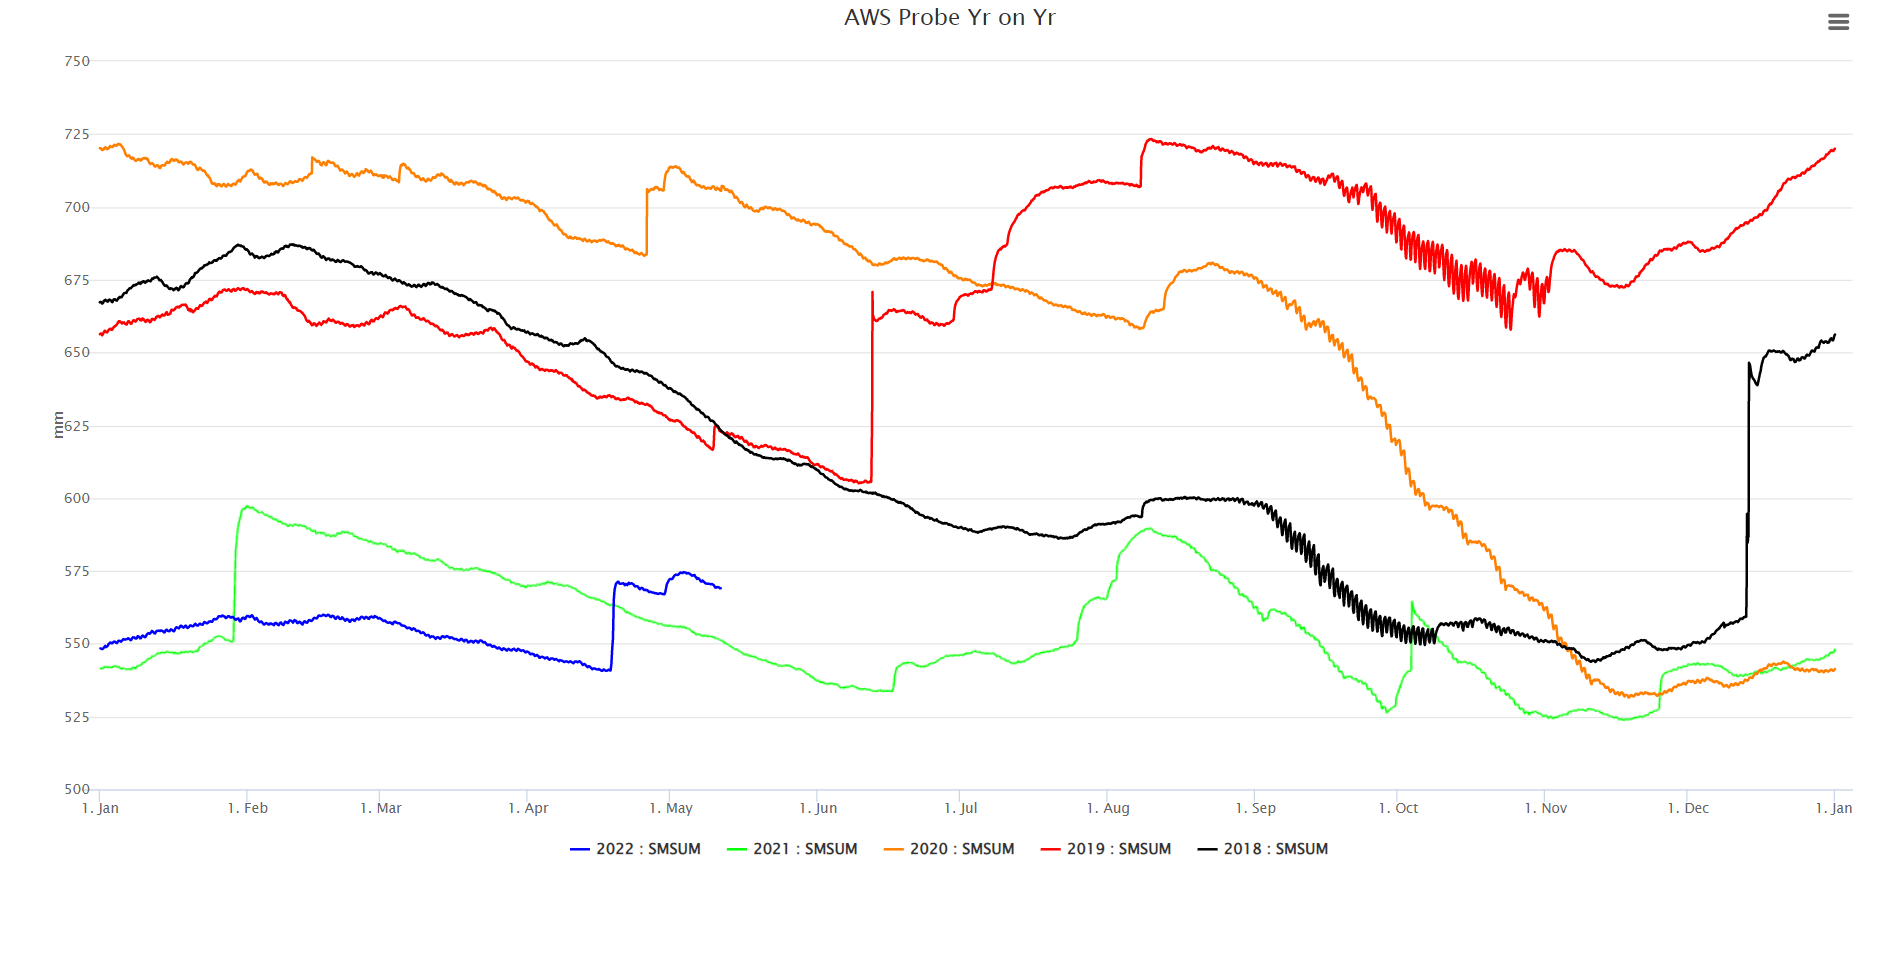
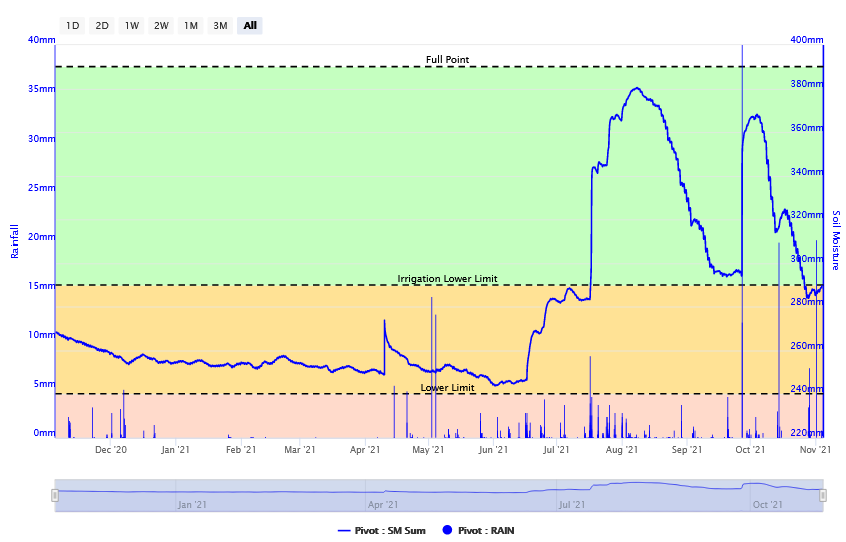
Adding all the sensors together (a summed measurement) gives a single measure of how full the soils bucket is. This is most often used as an indicator of how much water a given crop or pasture has to access, and what the potential is for future crop finishing and seed fill.
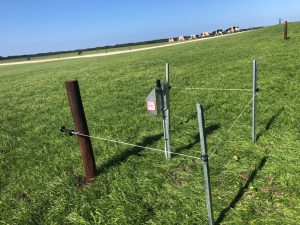
Matric Potential sensors work in the same way as a plant root. The scale of measure here is a measure of stress, or how hard the plant works to access water. For this reason they are often easier to use for crops and pastures that stress easily
We utilize two types of tension sensors at present. The watermark sensor is best suited for managing wet soils for water sensitive crops and vegetables, while the GB Heavy or malvic sensor is best used for crops that can tolerate dryer soils where matric potential data is still preferred.
Crops often serviced by matric potential sensors include:
> BushLinx can display soil moisture data with simple and advances displays
> Suitable for beginners and the expert
> Summed charts, stacked (seperate) charts, vertical profile, change heatmaps, gauges and maps
> Draw lines and colored sections, add comments and more to make decision making easier when looking at the graphics and interpreting data
