BushLinx® Display
A powerful yet simple to use graphical display for sensor and IoT data and decision making. BushLinx® has been built from the ground up off the back of more than a decade of user comments and feedback
We support private customers, Corporate and Government enterprises, delivering their IoT and sensor data needs whether its individual sites or region wide sensor networks, BushLinx® Display systems have been designed for you
BushLinx® is Australian made and owned. We provide all support and operations from South Australia. When you call us, we answer!
Features include:
> Powerful graphical display with a focus on simplicity
> Multi level user access and management
> Emphasis on decision making
> Reporting
> Real time mapping
> API support for data imports and exports
> Data sharing between users is simple, powerful and flexible
> Software site and field hardware management
> Remote configuration available
Importing existing data
Upgrading with existing field sensors and data loggers
We routinely provide an upgrade path so you may not have to re-buy “all new kit" to upgrade to BushLinx®
We support many common data loggers now, we may be able to avoid you buying all new equipment
Talk to us about your options, you might be surprised!
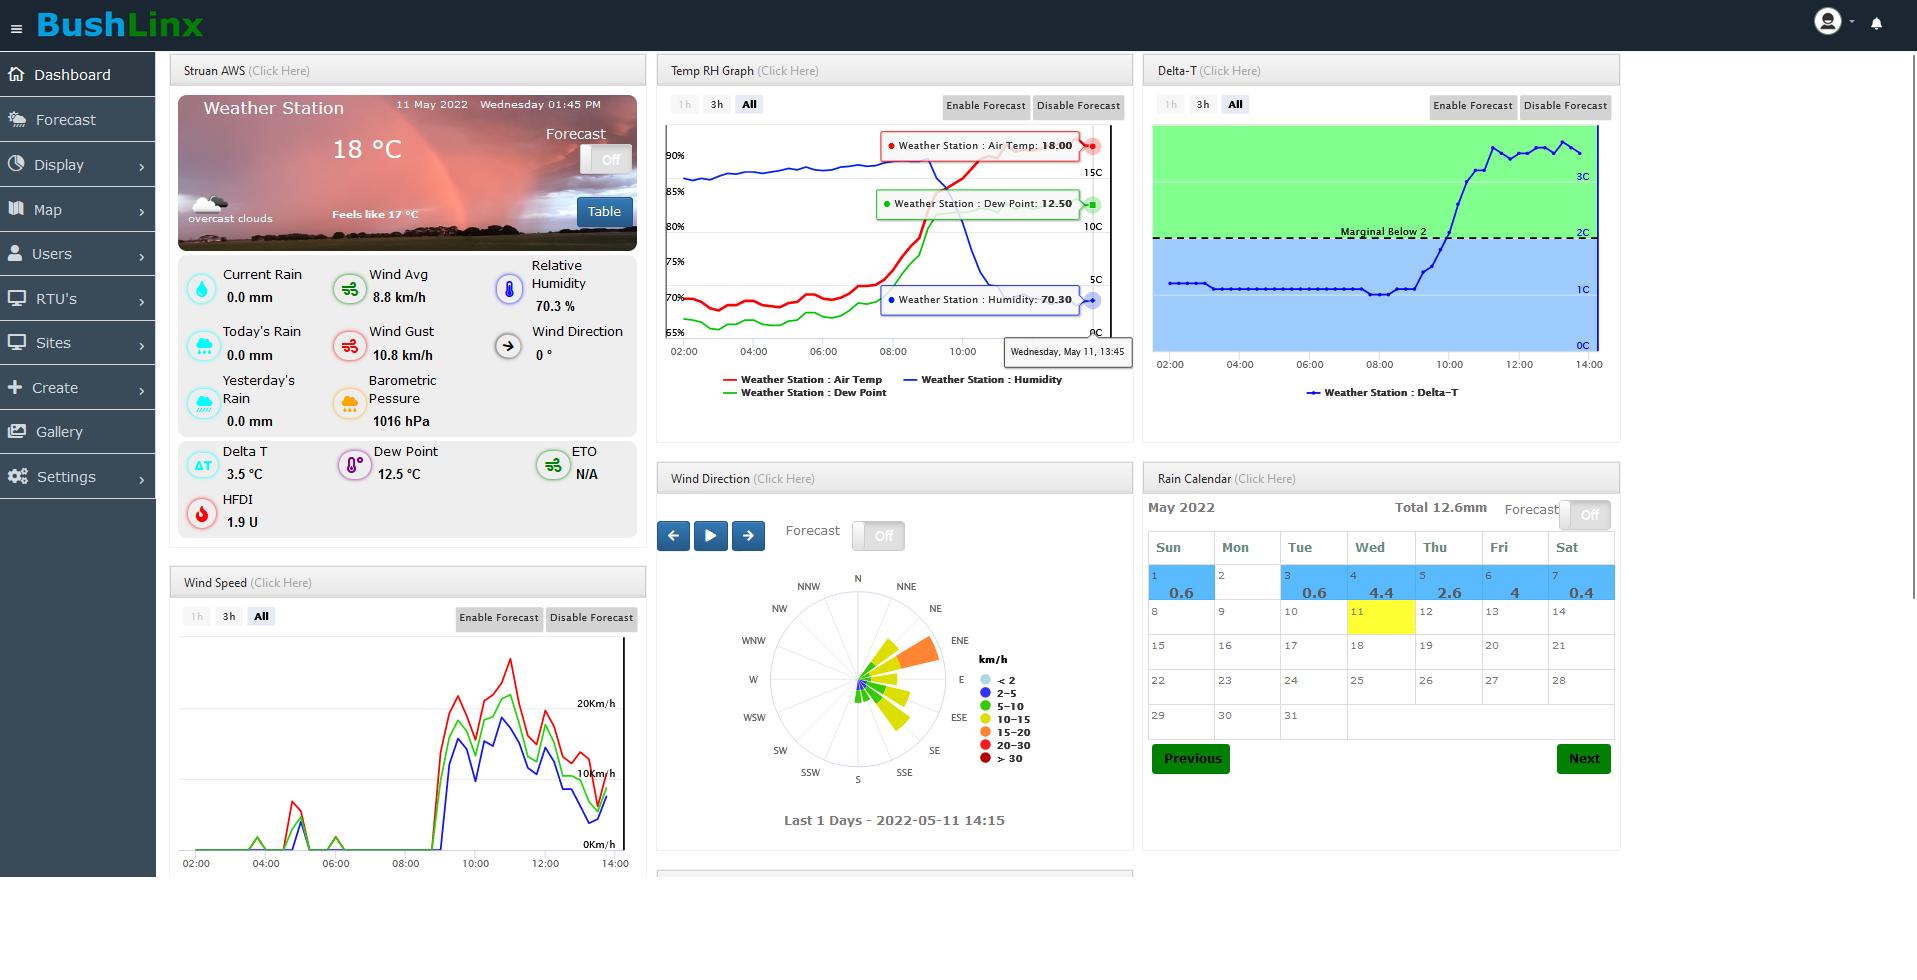
BushLinx Custom Dashboards
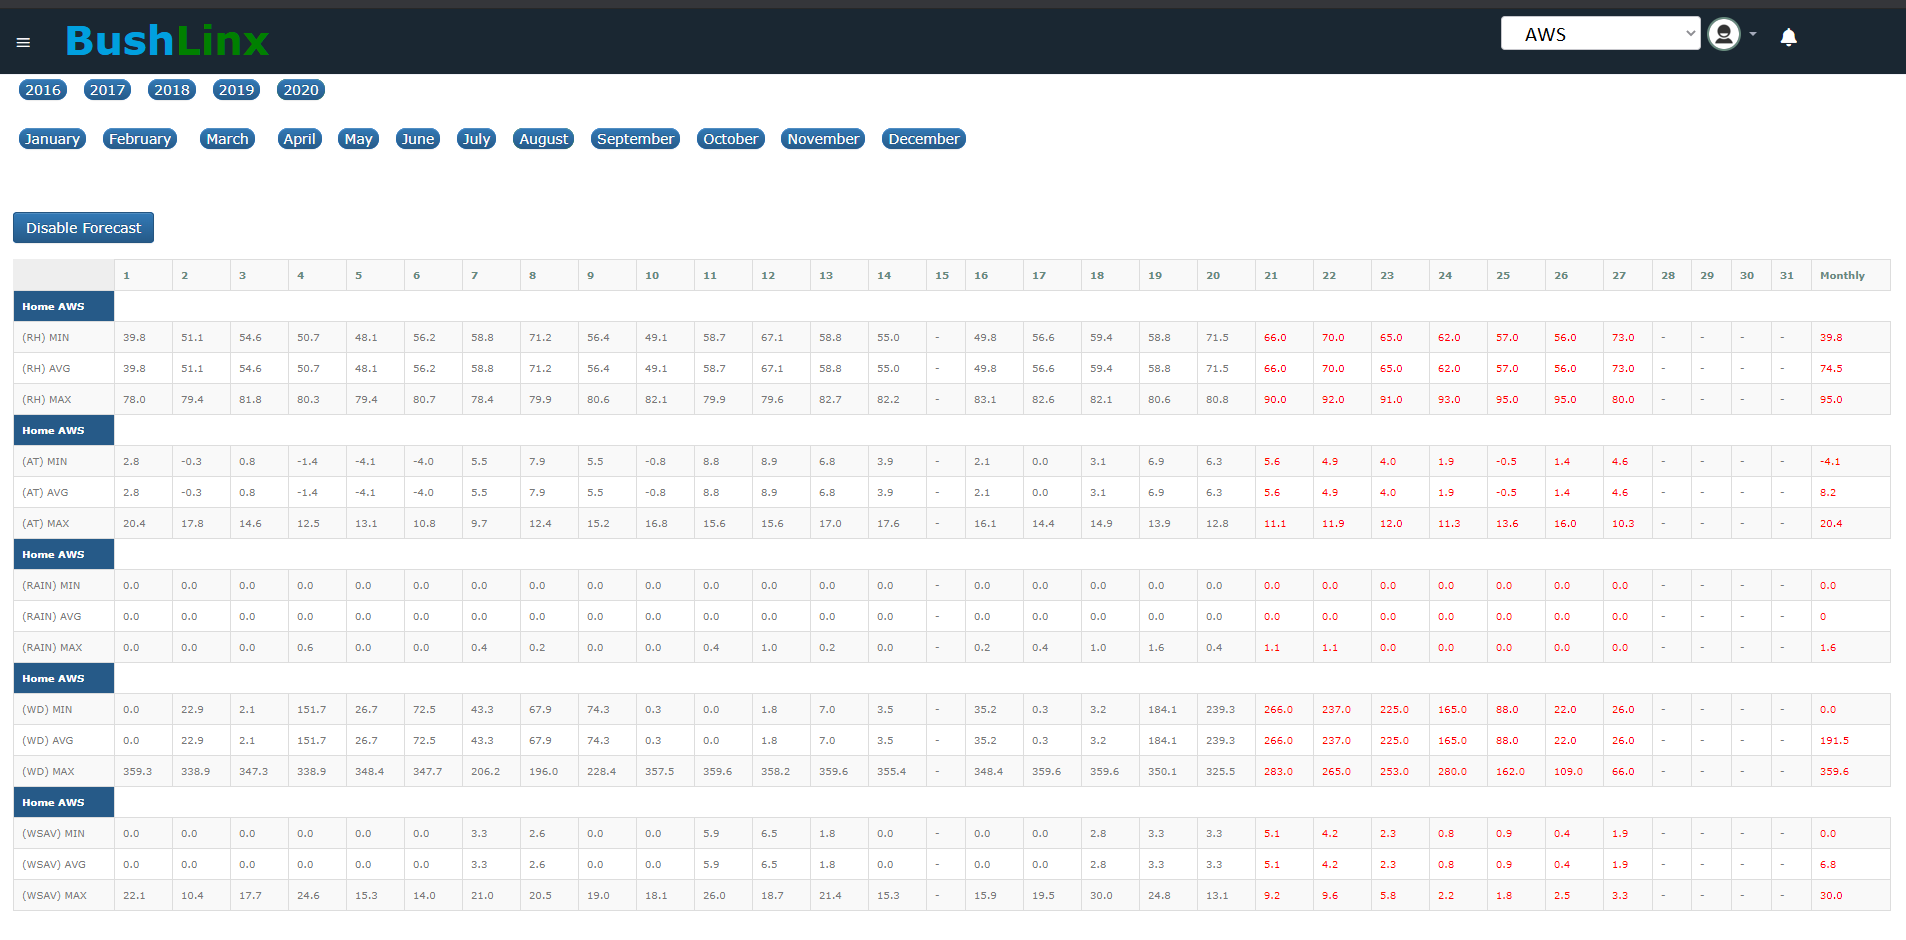
Simple and Advanced Tables
Advanced Gauges
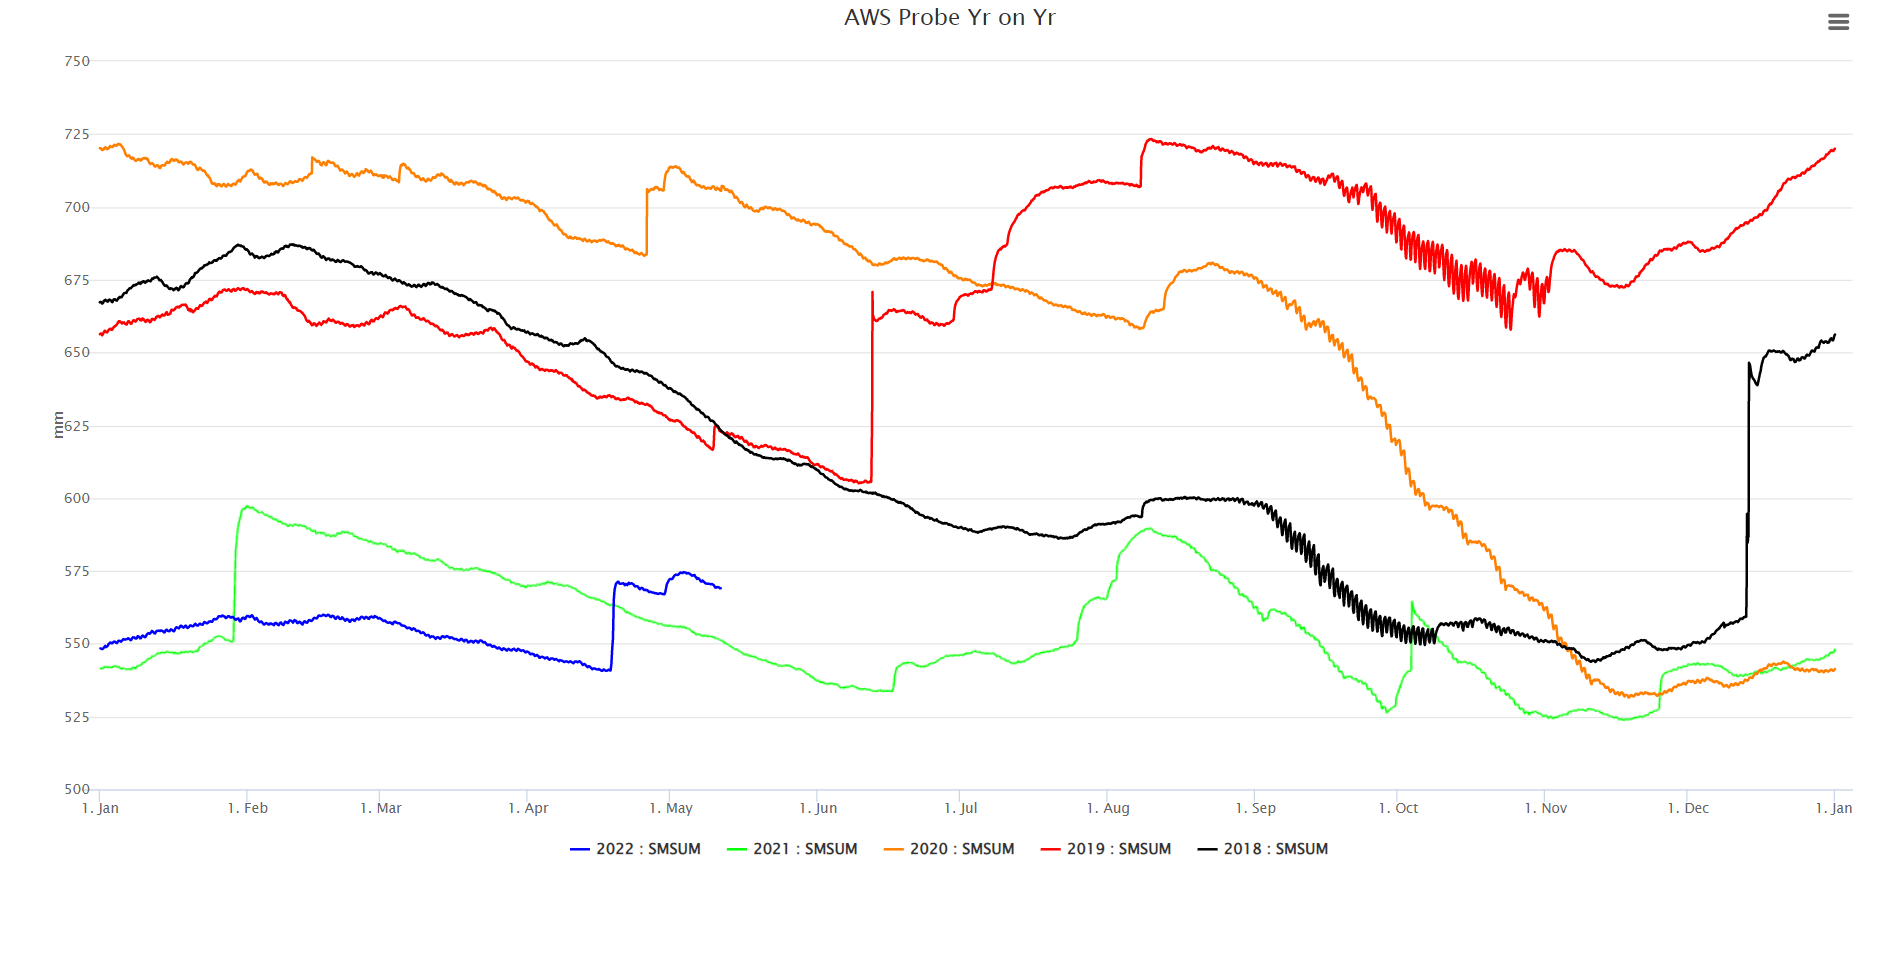
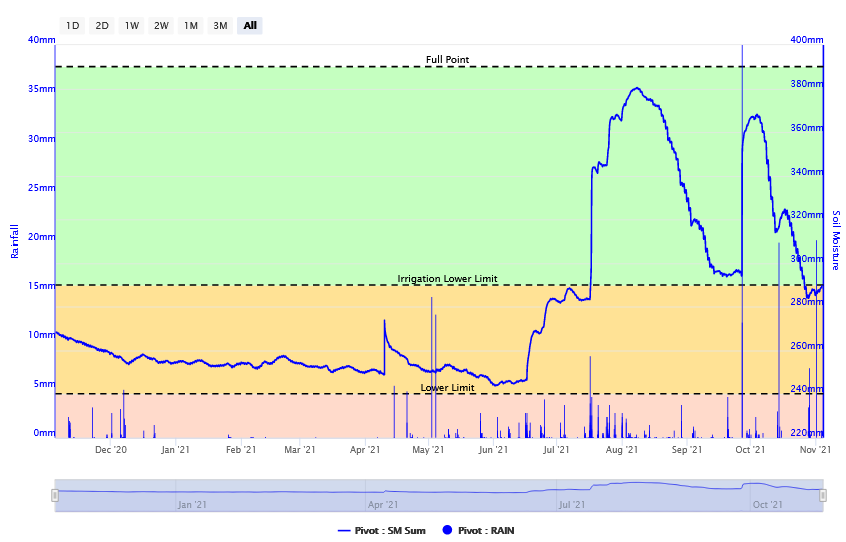
Multi-year Comparisons
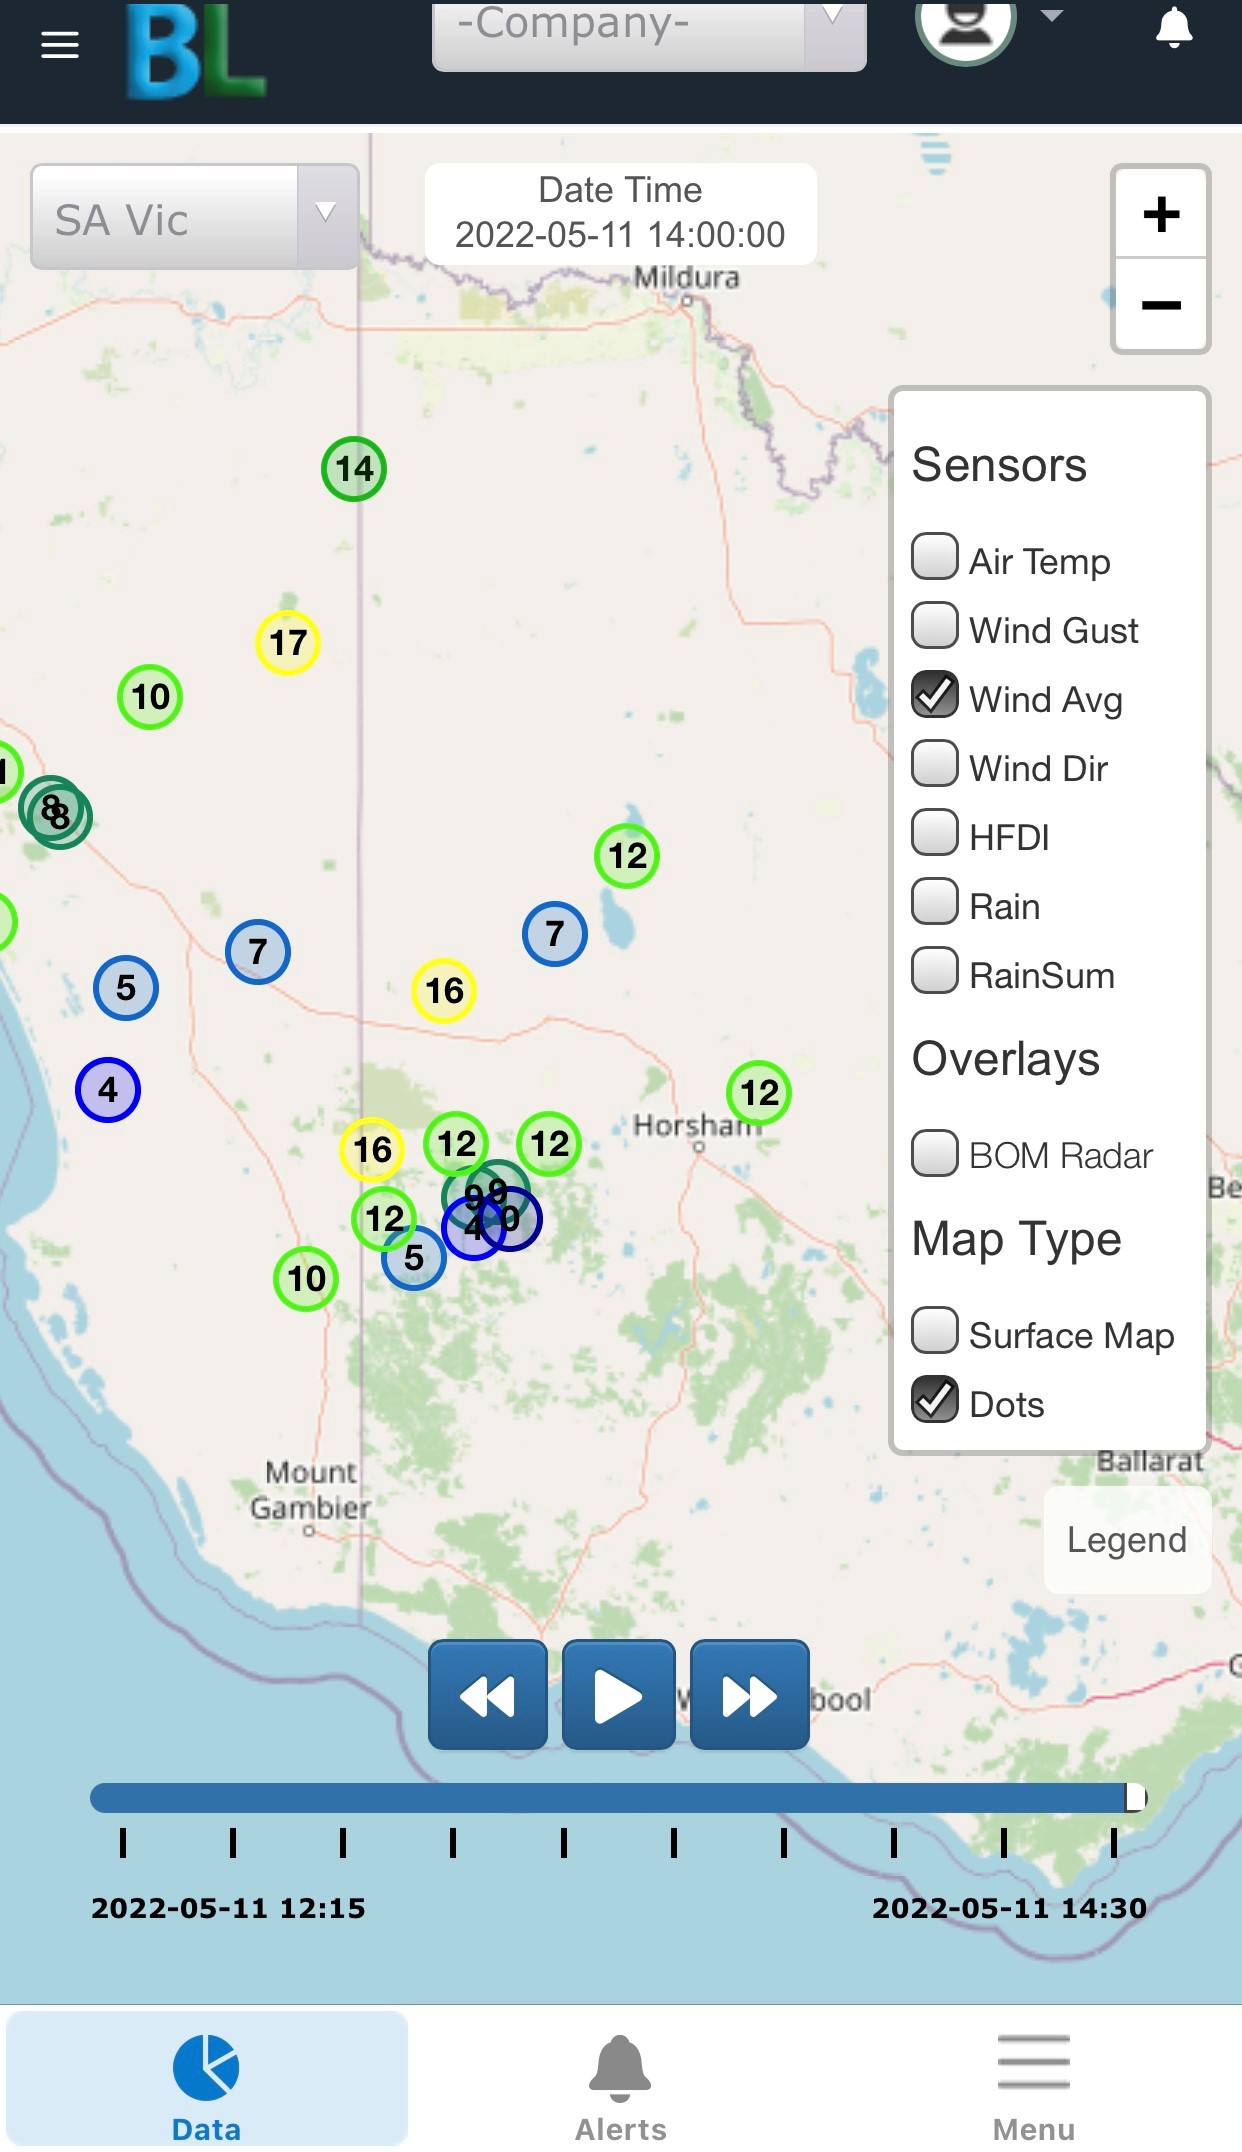
BushLinx Maps
Simple Charts
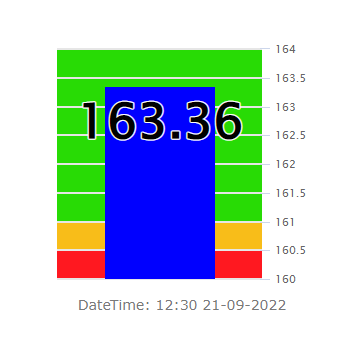
Simple Gauges
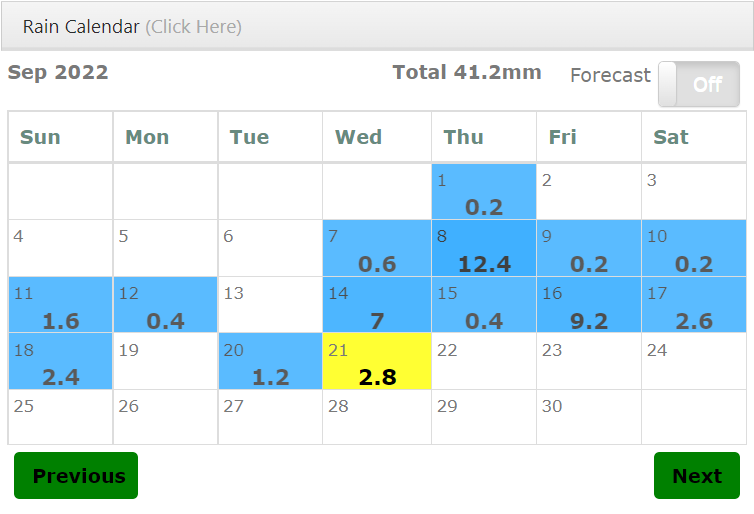
Rain Calendar
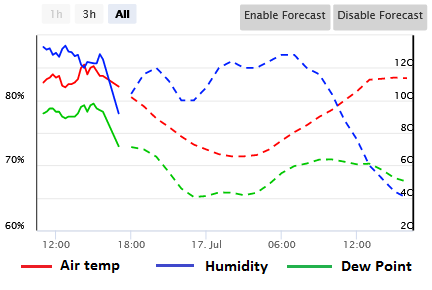
Fully Integrated Forecast
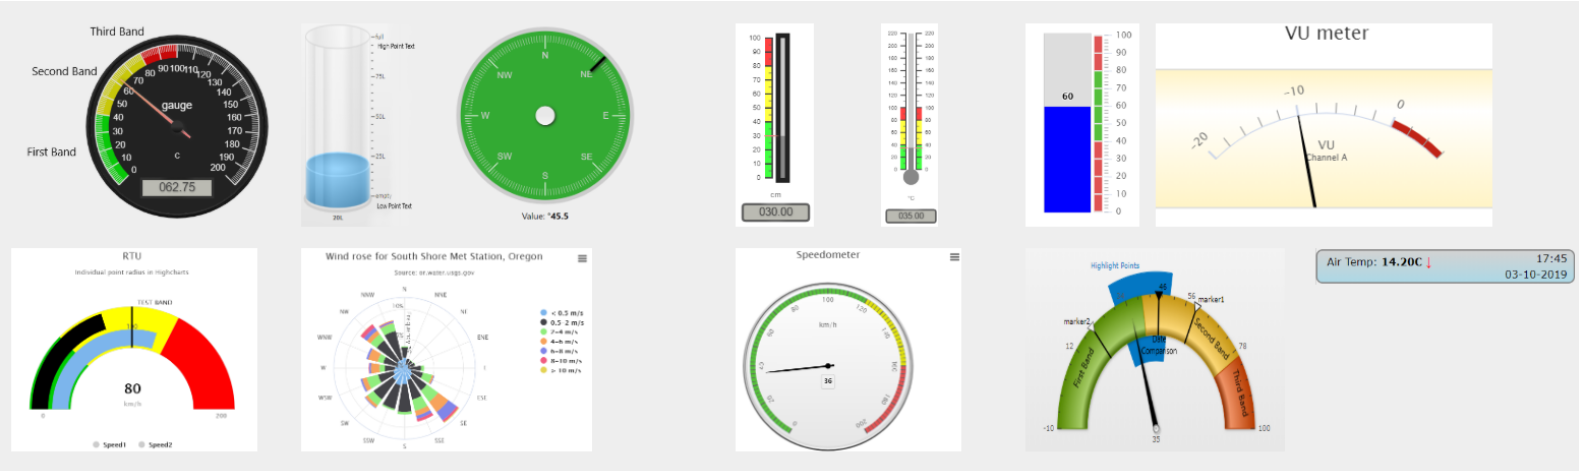
Gauges Library
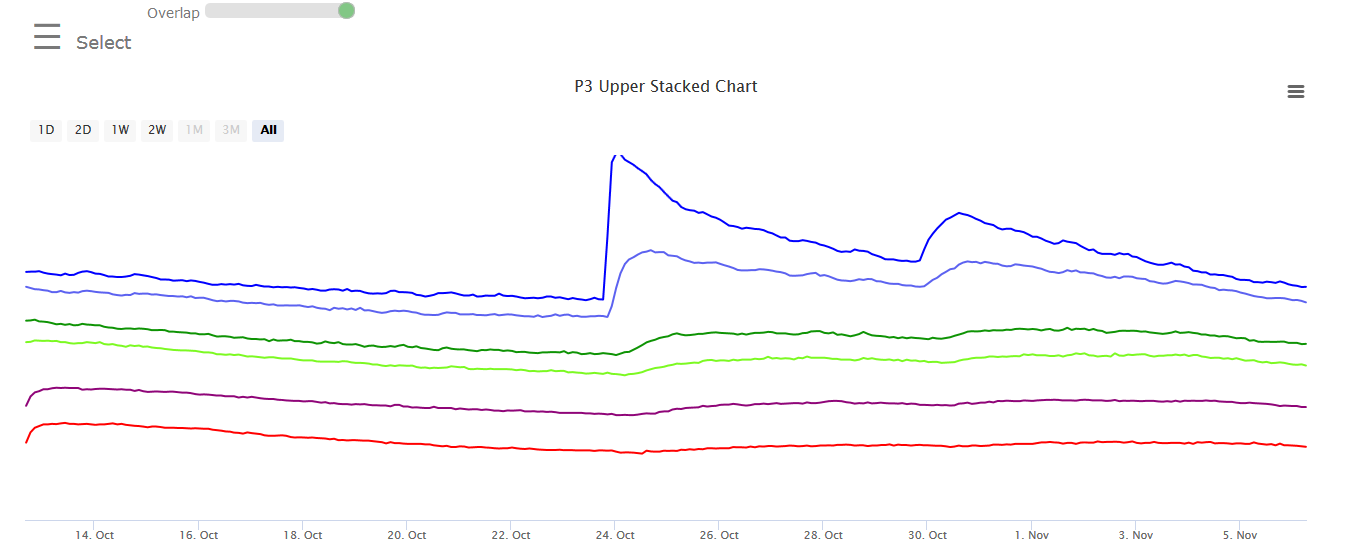
Advanced Charts